Introduction
In this article we will going to discuss two fundamental concepts in the Study of Statistics that is Population and Samples. Then will check what is Population mean and Sample mean.This article will break down the basic differences, the importance of each concept, and provide practical insights into their application in real-world studies.
Importance in Statistics
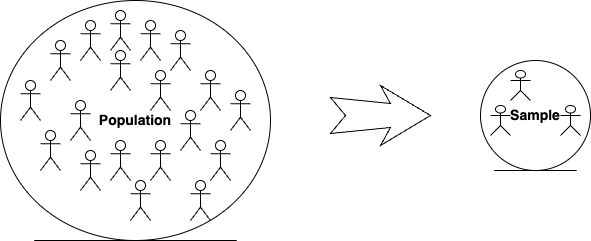
The differentiation between population and sample is essential since it is frequently unrealistic for researchers to concentrate on a whole population because of limits like time, cost, or accessible assets. In this way, analysts regularly use sample data, which are more modest, more reasonable subset of the population, to reach determinations and make statistical inferences about the more extensive gathering.
Population in Statistics
1- What is a Population(N)?
In statistics, a population alludes to the total arrangement of every possible observations or dataset. This can be individuals, creatures, items, or whatever is being examined. A population includes every individual within the group.
2- Types of Populations (Finite vs Infinite)
Populations can be finite or infinite. A finite population has a fixed number of members, like the number of students in a specific school. An infinite population, such as all stars in the universe, has no defined limit.
3- Real-Life Examples of Population
- All students in a Population
- Every car manufactured by a company in a year
- Every citizen in a country
Sample in Statistics
-
What is a Sample(n)?
It is a subset of population, used to identify valuable insights about the entire population. To ensure reliable results, it is essential that the sample accurately reflects the characteristics of the broader population.
Types of Samples (Random, Stratified, Cluster)
There are different sampling techniques:
- Random Sampling: Every individual in the population has an equal chance of being selected.
- Stratified Sampling: The population is divided into specific subgroups, and samples are taken from each one.
- Cluster Sampling: The population is grouped into clusters, and a few of these clusters are selected for study.
Real-Life Examples of Sample
- A group of 200 university students surveyed to understand the entire student population’s preferences.
- A set of cars tested for quality control.
- A survey of 1,000 citizens to predict election outcomes.
MUST READ: Left-skewed vs right-skewed : A Comprehensive Analysis
Key Differences Between Population and Samples
| Aspect | Population | Sample |
|---|---|---|
| 1. Definition | The entire group of individuals or items that you want to study. | A subset of the population used to represent and infer the characteristics of the whole group. |
| 2. Size | Generally large or infinite, including every individual in the group. | Small, manageable, and selected portion of the population. |
| 3. Representation | Includes every member of the group. | Should be representative of the population for accurate results. |
| 4. Time Efficiency | Studying the entire population is time-consuming. | Sampling allows for faster data collection and analysis. |
| 5. Cost Efficiency | More expensive to study the entire population. | Less expensive due to the smaller size of the study group. |
| 6. Data Accuracy | Provides accurate data with no need for inference. | Some uncertainty may exist, as conclusions are based on a subset. |
| 7. Use in Research | Rarely feasible due to size or impracticality. | Commonly used in research to make predictions or generalisations. |
| 8. Data Analysis | Descriptive statistics describe the entire population. | Inferential statistics are used to estimate population parameters from the sample. |
| 9. Variability | No sampling error, as the entire group is studied. | May involve sampling error, as not all individuals are included. |
| 10. Practicality | Impractical for large populations or dynamic groups. | More practical and efficient for studies involving large or complex populations. |
Population Mean and Sample Mean
Population Mean (μ):
The population mean is the average of all data points in an entire population. The formula for calculating the population mean is:
Population Mean (μ) = ∑X / N
Where:
- μ = population mean
- ΣX = sum of all data points in the population
- N = total number of individuals in the population
Sample Mean ():
The sample mean is the average of data points from a subset (sample) of the population. The formula for the sample mean is:
Where:
- x̄ = sample mean
- Σx = sum of all data points in the sample
- n = number of data points in the sample
the population mean is the average for the entire group, while the sample mean is the average for a smaller subset, used to estimate the population mean when analysing the whole population is not feasible.
Conclusion
In conclusion, populations include all individuals within a group, whereas samples consist of smaller, manageable subsets used to infer the traits of the whole group. Grasping the differences between these concepts is essential for carrying out successful research. By mastering sampling techniques, researchers can conserve both time and resources while still reaching valuable conclusions.

